The price of Star Health corrected significantly from our first purchase price. We have continued to buy on the way down and are now at an 8% position weight.
Original investment thesis
The industry provides a rare combination of “win-win-win” business with growth longevity, a strong moat and healthy ROEs.
- Consumers: It’s a must have product for consumers as Health issues can bankrupt families and should have priority in the Consumer wallet.
- Regulator: Wants more insurance coverage and hence should not grudge the industry a ~15% accounting ROE. There isn’t enough history in India for companies to model claim ratios over time (unlike Life Insurance where LIC has mortality tables). So the regulator permits price increases when product claim ratios becomes adverse. Star just announced an average 25% price increase in its flagship product.
- Company: Can grow premium at 15-18% CAGR for a decade (1.5%% natural increase in population growth, enhanced retail health insurance penetration (currently 4%), 6-7% medical inflation and 5-10% increase in covers with rise in Incomes) at 16-18% accounting ROEs.
Star has dominance on key success factors – agent network for distribution, hospital network and costs.
- The nature of the product – multiple exclusions on policies, assistance on reimbursements – means Health Insurance is an assisted sale. Over 75% of Retail Health is sold by individual agents where Star has dominance (more agents than other SAHIs 1put together).
- Star has amongst the largest number of hospitals empaneled, which is attractive to customers for cash less treatment.
- Its 33% market share – 3x the nearest peer – gives it the best negotiating clout with hospitals on treatment rates and leverage on fixed costs.
Concerns we have heard from other investors and our perspective on the same
- Health Insurance not a high ROE business as Claim ratios will increase over time.
- Peers have lower Claim ratios.
- Star has higher claims during FY22 vs peers.
- Star has higher claims denied.
- Possible entry of Life Insurers due to comprehensive license.
- Did we significantly overpay when we first entered?
Health Insurance not a high ROE business as Claim ratios will increase over time.
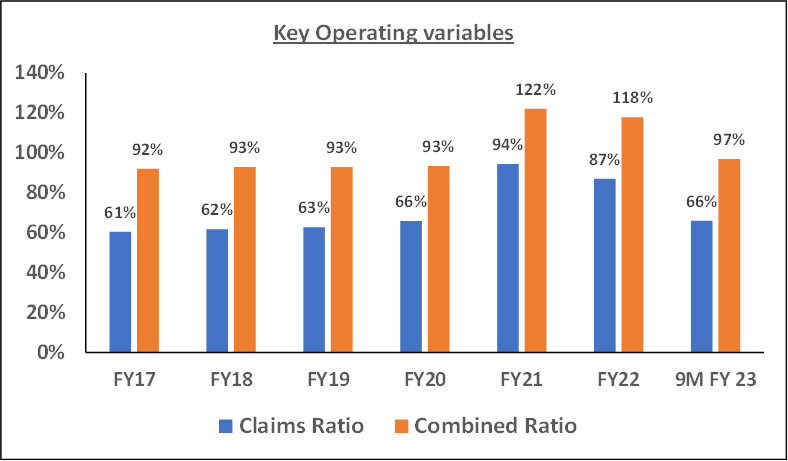
At 95% Combined Ratio 2 – core to our thesis – Star will earn a ~16% Accounting ROE.
- If the Combined Ratio is not sustained at ~95% or lower sustainably over time, we will be wrong.
- Star achieved 95% consistently prior to Covid 3 and is on track to deliver this in FY 23 4.
ICICI Lombard, a General Insurer, has generated an average GAAP Accounting ROE of over 18% between FY13 to FY23E. 5 We believe Standalone Health Insurance is a better business than General Insurance due to stronger distribution moats, natural price increases and higher renewal ratios.
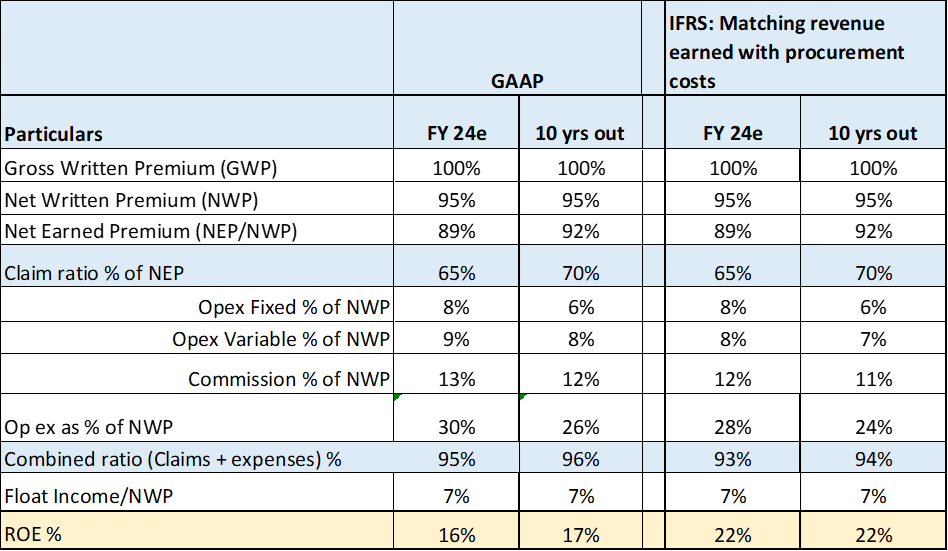
We believe the true ROE basis IFRS is > 20%.
- IFRS Accounting matches revenue with procurement costs and gives a more realistic assessment of true economics.
- Star renewal rates are 94%. This means procurement costs (we estimate at about 22% of Premiums) are overstated in Year 1 and should ideally be amortized over longer durations.
- Over time as pace of growth slows down, % share of Premiums recognized as revenue /Premiums underwritten (NEP/NWP) will increase.
- Hence, the true ROE under IFRS will be ~22% today.
ROE tree break-down under GAAP vs IFRS 6
Claim ratios will increase overtime and cause ROEs to decline.
Claim ratios do tend to increase over time as health incidents tend to increase with age, new customer growth slows and % of customers under exclusion period reduces. Our assumption is that Claim Ratios will increase by 5% over the next decade, but will be compensated by other variables such that the Combined Ratio remains between 94-96% over time.
- The regulator permits price increases basis claims and medical inflation – the regulator recently permitted Star an average price increase of 25% in its flagship product (~45% of premiums). It must be noted that unlike Life Insurance, Health Insurance does not have a long history which can be used for pricing.
- Greater specialized products in the mix which have lower claim ratios.
- Higher scale enhances price leverage with hospitals.
- Costs will reduce due to Operating leverage on Fixed costs and as Agents commissions get linked to claim ratios.
- Over time Star will invest more in proprietary channel/digital which will help reduce customer acquisition costs.
We see Star putting greater focus on profitability now vs earlier push for growth.
- Due to high life-time customer value (high renewal rates), we believe Star has been more focused on growth vs profitability in the past.
- One can see greater focus on profitability now – pricing has become more granular basis experiences on claims in specific geographies (risk based pricing).
- Group business has had higher claim ratios. Star is recalibrating its strategy in this segment which should help reduce aggregate Claim ratios.
- Within retail health, Star is selling more specialized critical illness products which have lower loss ratios. (Share as % of premiums has increased from 11% in FY21 to 16% in 9MFY23).
Insurance companies generate significant income from Insurance float. STAR is not fully optimizing the earnings potential from float as they come of an epidemic shock and are rightly more conservative at present. Over time, we believe Star could allocate more of the float to Equities. The regulatory maximum is 15% but Star allocation to Equities is 2% today. Higher float to Equities will boost Float Income.
Hence, we believe IFRS ROEs can sustain at 20%+ over time, even if Claim Ratios increase to 70% as multiple other levers exist to sustain ROEs.
Peers have lower Claim ratios.
Claim ratios across peers are not a like to like comparison.
- Peers have better claim ratios as their book are lower customer vintage, which means a larger share of the book is under exclusion. Star is amongst the oldest Private sector players.
- Product and customer mix across peers could be different. For example, CARE has a higher share of revenue from products that provide fixed benefits for example for Cancer Care vs Star (which has high share of indemnity products). Fixed Benefit policies tend to have lower claim ratios. 7 Star is more mass customer focused where sum assured per policy tend to be lower which results in higher loss ratios.
What matters is achieving a Combined Ratio of 94-96% which will enable a healthy ROE.
- A superior cost structure vs peers permits the same ROE, even with higher claim ratios.
- STAR Expenses/GWP was 30% vs 40% for CARE in FY 22.
Finally, even if we assume peers are more conservative companies, if Star can achieve 94-96% combined ratios and grow at 15-18% CAGR, that makes it a good business to own if IFRS based ROEs are over 20%. When other companies get listed, we can own others as well. At present, this debate is theoretical and not actionable.
Why did Star have higher claims during FY 22 vs peers?
There are multiple perspectives to this:
- The regulator encouraged players to take out Covid policies at rates set by the regulator. It is possible that Star aggressively signed up business while peers were more cautious.
- Differences due to product mix. CARE has more Fixed Benefit based policies which tend to have lower claim ratios.
- This is a business with high life-time customer value due to high renewal rates. Hence, higher claims in a year does not change the Investment thesis so long as the regulator is willing to approve price hikes due to adverse claim ratios.
And while Star has taken losses, it has also recruited many new customers to Health Insurance. And claim ratios are rapidly declining to pre Covid levels and STAR is on course to achieve its target claims ratio of 63-65% for FY23.
Star has higher ratio of claims denied.
Claims denied may be an erroneous metric as one cannot ascertain share of claims denied as customers have hidden past history.
Star mentioned on its last earnings call that “80% of the amount in 9M-FY2023 were settled in claims through cashless …. turnaround time remained around 2 hours”. These metrics do not suggest intention to deny claims, rather, suggests process is designed to enhance customer satisfaction.
Customer renewal ratios are very high at ~94-95%, which wouldn’t be the case if Star was erroneously rejecting genuine customer claims. The regulator has recently permitted Star an average 25% increase in its flagship product which accounts for about 45% of Star premiums. The regulator would not permit these if it felt Star was rejecting genuine claims.
Entry of Life Insurers into Health Insurance from the Universal License
Health Insurance is a very operationally intensive business vs Life Insurance due to the need to sign up hospitals, constantly negotiate rates for procedures and process genuine claims. Life Insurers will be significantly disadvantaged on cost as this infrastructure needs to be created afresh. We estimate Star has a fixed cost of about 1000 Cr on GWP of 12000 Cr with 33% industry market share. Subscale players will need TPAs which will make them uncompetitive vs leaders on costs.
Over 75% of industry premiums are through agents, unlike Life insurance which rely more on Banks for distribution. Star has more agents than other SAHIs put together and enjoys 50% higher productivity vs the next best SAHI Niva Bupa (1.78 lacs vs 1.19 lacs in 2022) which aids agent stickiness. Customers have no incentive to switch as STAR has the best cost structure and can offer competitive pricing and has amongst the best hospital networks, which reflects in high customer renewal ratios.
This move is likely to see more bundled products (Life + Health protection) being sold, something which even STAR would consider selling. Hence, while it will increase competitive intensity, it does not impact STARs competitive position significantly.
Did we significantly overpay when we first entered?
An important question to ask is what would define a good return for Equities this decade. This will influence prices we are willing to pay for different companies. We believe the Index will compound at about 9-11% this decade, lower than nominal GDP growth as Current Market Cap/GDP at 99% is well above long term averages (80%) and monetary policy globally is a head wind. If our goal is to create 3% Alpha post fees, then ~15-17%+ estimated IRR in a growing franchise, early in the growth cycle with strong leadership is an attractive return to aim for.
Fair value of any company is a function of growth longevity, ROE and competitive position.
- We believe Star is early in its growth cycle and hence can grow 15-18% CAGR for long durations.
- Is a >20% ROE business under IFRS accounting. Most businesses report lower profits under IFRS vs GAAP. Health Insurance will report higher profits under IFRS.
- Star’s competitive position is improving – it is becoming a Retail Consumer proxy as it reduces its group business. The new regulations on expenses (capped at 35% of GWP) enhance STAR competitiveness in the retail business as lower scale SAHI competitors would find it hard to compete with Star on pricing and would need to find niches or the Group segment to compete. This leaves Star very well positioned to keep gaining market share in the mass market.
If Star executes well, we believe it can generate about 5000-6000 Cr PAT under IFRS by FY33. As a consumer proxy with high granularity in customer base and a high terminal value, we work with a 30x trailing Earnings multiple on IFRS Earnings basis FY33 earnings estimates.
- Basis this, Star can be about a ~160000 Cr Market Cap business by FY33. For a ~15% IRR over a decade, the fair market cap for entry worked out to ~40000 Cr, roughly the price at which we first Started buying.
- Star is a linear story; hence one can use near term multiples to assess fair value. Basis approx., 1000 Cr in Accounting profits in FY24 (IFRS profits should be about ~1300 Cr – SOL Estimates), Star trades at about ~25x 1 year forward PE today vs about ~31x when we first bought.
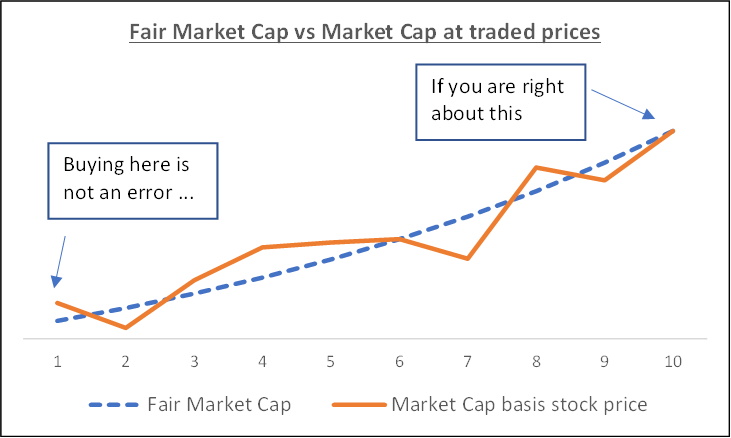
When one encounters a decadal compounding opportunity, one should not obsess significantly about the entry price if one is broadly right. The ability to add over time on corrections can help boost returns or correct any initial valuation errors which are only apparent on hindsight.
As the price declined, we added to our position and our effective buying price is now ~10% below the price at which we entered. We are at 8% position weight in most accounts at present vs 10% peak position weight we use for Financials.
Please click here if you would like to download the PDF version of this blog.
- SAHI – Stand Alone Health Insurer ↩︎
- Combined Ratio = {Claims/Net Premium recognized as Revenue} + {Expenses/Net Premium Written} ↩︎
- Note: Star has changed revenue recognition policy in FY 21. The new method lowers Revenue recognized/Premiums collected and is therefore more conservative. ↩︎
- This data is not adjusted for change in accounting policies in FY 21. ↩︎
- ICICI Lombard Business model is not fully comparable with Star as Lombard enjoys larger investment float from Motor TP book, which translates to a higher overall investment leverage of ~4.15x versus 2.2x for Star today. ↩︎
- IFRS estimates are very rough Solidarity estimates. ↩︎
- Source: Discussion with industry players ↩︎