Summary
Investment thesis: Vasa’s investment thesis is premised on Vasa becoming the “category-defining platform” for online dental supplies in India, akin to Nykaa in beauty. The dental supplies market is growing, online penetration is rising, and Vasa is already the category-leader.
Promoter quality: Vasa is backed by a complementary promoter duo — a dentist who deeply understands customer pain points and a software professional who understands technology. They have executed well, growing sales from Rs. 30Cr in FY20 to Rs. 77Cr in FY22, Rs. 170Cr in FY24, and ~Rs. 300Cr in FY26E. Notably, the company has been built frugally rather than massive VC funding, and has been profitable throughout its journey, unlike most VC-backed e-commerce companies. We like their strong long-term orientation.
Early on growth lifecycle: Vasa is very early in its growth lifecycle. We believe Vasa can scale to Rs. 750–900 Cr in revenues (20–25% CAGR on FY25 base) by FY31. This is feasible due to a low online dental retail penetration in India (vs. 40% in the US and Europe), Vasa’s dominant industry position, a decade of customer data and a comprehensive SKU basket creating a strong data moat, and multiple operational levers management is actively working on to boost growth. As Vasa grows larger, its competitive edge vs peers will expand further.
Valuation approach: Vasa should not be valued on trailing multiples. The current focus is on improving customer delivery timelines and reducing stock-outs, which will result in market share gains. Once this is achieved, margin expansion and inventory optimization will inevitably follow — a trade-off we strongly agree with. Management has been explicit about the same: “this year (FY26) is about building the engine. The acceleration will follow.” We believe there is meaningful non-linearity in earnings ahead.
Return potential: At Rs. 750–900 Cr in revenues by FY31, we believe Vasa could deliver 8–10% PAT margins (Rs. 60–90 Cr PAT) and 30%+ pre-tax ROIC.1 At that stage, given the combination of growth longevity, category dominance, and ROIC, the business could command a 30–40x P/E multiple, implying 25–45% IRRs from current levels. This is our base to bull case scenario.
Position sizing: We have strong conviction in the opportunity, the promoters and their long-term orientation. There is an opportunity of an Asymmetric upside if our thesis plays out. But we would still classify the business model as under evolution – inventory normalization and 12%+ margin (key to healthy ROIC) are yet to be demonstrated at scale. Hence, we cap the position at 3% in Prudence and 5% in the Microcap AIF until we see further evidence of execution.
What does Vasa do?
Vasa Denticity, founded in 2016 by Dr. Vikas Agarwal and Mr. Sandeep Aggarwal, is an e-commerce platform specializing in dental products sold via dentalkart.com. Its customers are dental clinics, hospitals, and other medical establishments. The business is predominantly B2C (individual dental practitioners constitute ~98% of online sales and ~90% of overall revenues), making it more akin to a B2B marketplace serving fragmented small practices than an institutional supplier.
The website sells dental products across three categories:
- Consumables (~71% of sales) filling materials, impression materials, etc.
- Instruments (~6% of sales) forceps, probes, mirrors, etc.
- Equipment (~23% of sales) dental chairs, X-ray machines, autoclaves, etc. Equipment mix has increased in recent quarters as Vasa has made a deliberate push into higher-value equipment (dental chairs, 3D scanners, milling machines) though management has clarified this is a tactical emphasis, not a structural shift away from consumables.
- Through its subsidiary Smileworks, Vasa has entered manufacturing custom-made crowns, bridges, and clear aligners etc.
Products are sold under both own brands and third-party brands:
- Own / private-label brands: ~50–56% of revenues; Gross Margin ~45-50%.
- Third-party brands: ~44–50% of revenues; Gross Margin 10–15%.
Long-term target is for own brands (including exclusive international distribution rights) to reach ~70% of revenues, which would aid margin expansion.
How is Vasa trying to win and progress made
An on-line retail model is distinctly superior to an off-line model due to ability to offer more SKUs, more convenience and avoid the costs of physical infrastructure, especially in categories where customers don’t need to visit premises. In the Dental industry, timely supply of products is critical as procedures are scheduled. Hence, fast and timely delivery is critical. An on-line platform like Dentalkart, with warehouses close to customers for fast delivery and leveraging technology for better insights can become a dominant player if the virtuous cycle plays out.
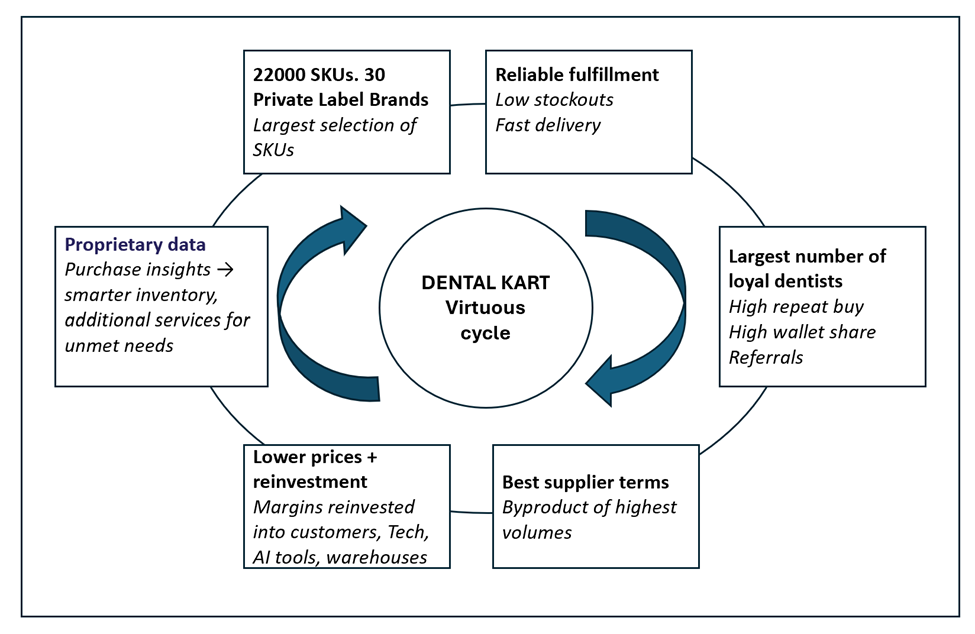
Vasa is already the dominant player at present by a long mile. While it started primarily as a marketplace model (low inventory days), it is now pivoting to an inventory model to improve product availability and reduce stock-outs and investing in warehouses closer to key demand centres to reduce delivery timelines.
Reported Financials
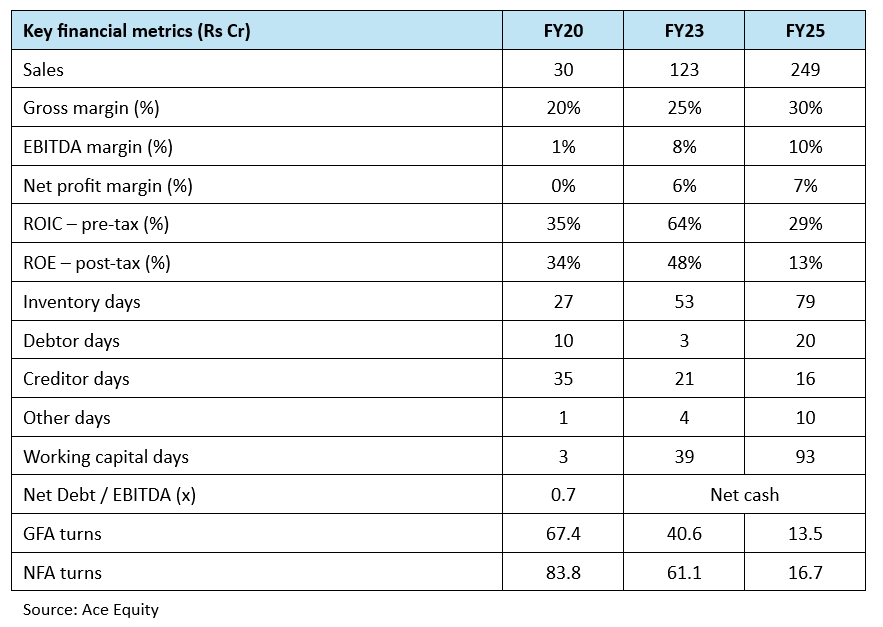
Key observations:
Gross margins have expanded from 20% (FY20) to 30% (FY25), driven by rising private-label mix. The working capital build (3→93 days) and ROIC compression (64%→29%) are a direct consequence of the deliberate shift to an inventory-led model, to introduce new products, and expansion of warehouses closer to customers to reduce delivery time.
Investment thesis
Attractive Long term growth prospects
Sizeable market opportunity
- There are 4–5 lakh dentists in India.
- Average consumables spend per dentist: ~Rs. 40k per quarter (~Rs. 1.6 lakh annually) → consumables TAM: Rs. 6,000+ Cr. Equipment, Instruments and dental implants add a further Rs. 5000-8,000 Cr.
- Adjacent opportunities include dental lab prosthetics — a Rs. 6,000 Cr market in India (crowns, bridges, prosthetics) that Vasa is now addressing via Smileworks Pvt Ltd.
- The industry is highly fragmented (95–97% still sourced offline), with online penetration at only 3–5% vs. ~40% in the US and Europe.
Online adoption by dentists should increase structurally
- Wider product variety: Online platforms offer 18,000–22,000 SKUs vs. ~200–250 with local dealers allowing dentists to access specialized instruments and consumables that are often unavailable through local distributors.
- Authentic products: The fragmented local distribution system is often plagued by counterfeits; online channels offer greater assurance.
- Convenience and speed: Faster delivery is the single biggest driver of wallet share.
- Price transparency: Dentalkart prices are typically 3–5% below offline dealers on most products since it buys directly from manufacturers.
Vasa is well positioned to capture this shift
- Vasa is the largest online dental platform in India — the second-largest online peer is estimated at only Rs. 20–25 Cr in revenues.
- Early-mover advantage is significant: almost all registered dentists in India have at some point visited the Dentalkart platform. The core challenge is converting this traffic into higher wallet share — currently, most Tier 1 and Tier 2 city dentists use Dentalkart as a secondary (not primary) source, purchasing items unavailable locally rather than their full consumable basket.
- Vasa offers ~22,000 SKUs; management targets ~35,000 overtime benchmarking against Henry Schein (the US dental supply leader).
- With ~10 years of customer data, the company has built strong insights into buying behaviour, which aids product selection, pricing, and inventory decisions.
- A loyalty/membership programme has been launched — early data shows membership customers order ~9x per year vs. 4.2x for typical customers, a strong lever for ARPU expansion.
- Its private-label strategy materially enhances profitability — gross margins of ~45-50% on own brands vs. 10–15% on third-party — and own-label products offer quality comparable to MNC brands at lower price points.
Vasa has demonstrated strong execution, even though customer retention and stock-out reduction need more work
- Revenue has grown from Rs. 30 Cr in FY20 to a ~Rs. 280 Cr run rate (TTM Q3 FY26), built in a highly fragmented market.
- Platform metrics confirm ongoing engagement: 70% repeat purchase rate (FY25), 4.8 lakh monthly active users.
- Inventory write-offs have been negligible — Rs. 8 lakhs of impairment in FY25 on a Rs. 53 Cr inventory base. Only Rs. 1.8 Cr of inventory exceeded one year in age, and the company has RTV (return-to-vendor) arrangements with most domestic suppliers, providing a safety valve on slow-moving stock.
- The company has a strong balance sheet with Rs. 53 Cr net cash, providing capacity to invest in new SKUs, inventory, and growth infrastructure.
Significant headroom for revenue growth, margin expansion and ROIC improvement
- Vasa is a Rs. 280 Cr company in a Rs. 15,000–20,000 Cr market.
- Currently, ~105,000 dentists transact on the platform with average quarterly spend of ~Rs. 4,500 — a small fraction of their total requirement of average ~Rs. 40,000 per quarter. If wallet share per dentist moves from the current ~15% to ~40% (management’s stated target), and active customers grow from ~105k towards the full ~3.2–4 lakh registered dentist base, the revenue potential is multiples of the current run rate.
- Scale will enable better supplier negotiating leverage — deployable to build market share or expand margins.
- Artificial Intelligence driven automation of customer service and operations should drive meaningful efficiency gains.
| SS ROIC Tree Table | FY25 | FY31e | Comments | |
| Scenario 1 | Scenario 2 | |||
| Sales | 100 | 100 | 100 | |
| EBITDAM % | 9.6% | ~11-12% | ~13-14% | Private label mix improving, operating leverage in warehousing/logistics costs, AI-led automation driving efficiency in customer service and operations. |
| Depre % of Sales | 0.7% | 0.6% | 0.4% | |
| EBITM % | 8.9% | 10.7% | 13.3% | |
| Core PATM % | 6.3% | 8.0% | 10.0% | |
| GFA Turns (X) | 12.7 | 18.0 | 22.0 | Asset base built ahead of demand → higher turns as growth scales. |
| NFA Turns (X) | 15.8 | 37.0 | 45.0 | |
| Debtor days | 20 | 22 | 22 | |
| Inventory days2 | 79 | 100 | 100 | Inventory to increase near term. But will normalize to ~100 days as pin code level data helps plan inventory better. |
| Creditor days | 16 | 20 | 20 | |
| Other days | 9 | 10 | 10 | |
| NWC Days | 92 | 112 | 112 | |
| Pre -Tax ROIC % | 29% | 32% | 41% | Overall, margin expansion + asset turns drive ROIC improvement. |
Management’s growth levers
- Stock outs impact customer experience, create revenue loss and thereby can impact the virtuous cycle. Hence, all actions to fix these even at the cost of near-term margins and ROIC.
- Migrating from marketplace to fully inventory-led model to better control stock-outs and ensure customer stickiness.
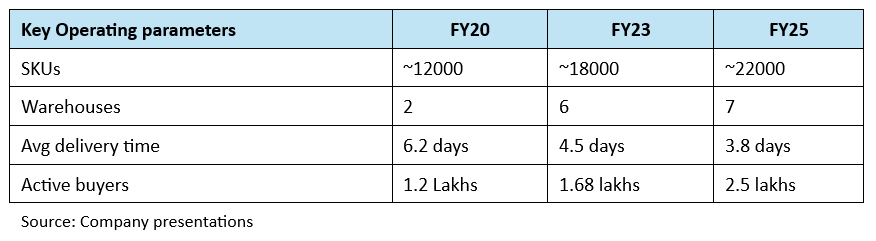
- Expanding warehouse network to reduce delivery time: Warehouses now operational across Bangalore, NCR (Dwarka — relocated to be airport-adjacent for same-day dispatch), Bhiwandi, Nagpur, Kolkata, and Guwahati. Total footprint of ~58,000 sq ft. Delivery timelines have improved from 5.5 days (FY23) to 3.8 days (FY25). Target is sub-48-hour national average delivery; same-day delivery already live in Delhi, Mumbai, and parts of Bangalore.
- Exclusive international partnerships: Vasa has entered 6+ exclusive distribution partnerships and multiple equipment exclusive tie-ups. These partnerships require initial inventory investment but carry margins similar to own-label (~45-50% gross margin range).
- Smileworks (Dental lab): Vasa acquired 60% of Smileworks (an 8-year-old Delhi lab; Rs. 5 Cr topline, healthy EBITDA at acquisition) for Rs. 3 Cr in Jan 2025. The dental lab prosthetics market (crowns, bridges, implant prosthetics) is estimated at Rs. 6,000 Cr+ in India and is a natural extension of Vasa’s existing dentist customer base — the same 1 lakh+ dentists who buy clinical consumables also need prosthetics.
- Feet on street / offline presence: Vasa launched offline operations post-IPO with 100+ channel partners and 60+ on-ground sales staff. This hybrid strategy is designed to win Tier 1 city dentists where speed of local distribution remains an advantage — a structural gap that online-only cannot immediately close
- Service centres: Equipment service quality is a known friction point for Tier 1 dentists. Vasa has opened 3 service centres (including Chennai), with a target of covering all Tier 1 cities within 2 years. Service capability is expected to unlock higher equipment sales by reducing the post-purchase anxiety around maintenance.
- Platform modules and digital dentistry: Vasa is building 8+ additional platform modules: a dental education platform, a dental lab tracking system, clinic management software, and agentic AI for customer service. It is also actively promoting digital chairside dentistry adoption (3D intraoral scanners, milling machines).
Why we want to back these promoters
The promoters are a complementary duo: Dr. Vikas Agarwal (an erstwhile dentist, CMD) brings deep understanding of customer pain points, while Mr. Sandeep Aggarwal (software engineer, COO) is building the technology backbone.
The business was built frugally and without much VC funding — Vasa went directly to public markets via a SME IPO, has been profitable since inception, and has maintained capital discipline throughout.
They are thinking long term:
- Investments in warehousing, delivery infrastructure, exclusive international partnerships, Smileworks, and platform modules all signal a long-term orientation.
- They are willing to compromise short-term profitability for a stronger competitive position.
- Management has been increasingly transparent with investors —in H1 FY26, they directly addressed the tough questions on slower growth, inventory build, and margin compression rather than deflecting the same.
“Right now, I am primarily focused on market penetration and wallet share, given our position and the long runway. Faster delivery, more products, and higher inventory are all ways to deliver more value and deepen that penetration, even if it means accepting some short-term inefficiencies.”
“If I am at ~₹250 crore revenue and I see a ₹20,000 crore market, there is a lot to be done. In doing that, I may compromise on some short-term metrics in order to build long-term strength. Therefore, it is hard to pin this down as a ‘two-quarter’ vs ‘four-quarter’ transition.”
“This year is about building the engine. The acceleration will follow. We are not optimising for the next quarter. We are optimising for long-term free cash flow per share and long-term leadership in a market that is still in its early growth cycle.”
Valuation Framework
Vasa cannot be valued on trailing-multiples. The company is still early in its growth journey, investing ahead of the curve — margins and inventory are not at steady state, and the current focus is on market share gains, not cash flow optimization. There is meaningful non-linearity in earnings ahead as the model matures. Hence, we need to have some broad estimates of what the company profits can be in a few years and discount backwards.
Our base case scenario: Vasa scales to Rs. 750–900 Cr Revenue by FY31 (20–25% CAGR on FY25) by
- Higher private-label mix (target ~70% vs. ~50–56% today) — the single largest margin lever
- A broader and more differentiated SKU base (~35,000 target vs. ~22,000 today)
- Operating leverage from scale — warehousing and logistics fixed costs do not grow linearly; tech is already capable of handling 3x current volumes
- AI-driven efficiency gains across customer service and operations
- Incremental revenue streams from Smileworks (dental lab), exclusive distribution partnerships, BNPL-facilitated new clinic setups, and the education/events platform
This should translate into 8–10% PAT margins (Rs. 60–90 Cr PAT) and 30%+ pre-tax ROIC. At that stage, the combination of category dominance, growth longevity, and ROIC quality should support a 30–40x P/E multiple — implying 25–45% IRRs from current levels over next 5 years if the thesis plays out.
The consumable nature of the core business (relatively resilient and recurring demand) may support a valuation premium above what we are currently underwriting. Strong management teams frequently surprise on the upside through adjacencies that are difficult to envisage today.
Risks
Key risks we see include:
- Execution, for example, deepening Tier 1 penetration: Vasa is primarily the secondary (not primary) supplier for most Tier 1 and Tier 2 city dentists. Management has acknowledged this explicitly — local distributors currently deliver faster for the products they stock, making the speed gap the key barrier to wallet share gain in metros. Until sub-2-day delivery is consistently achieved in major cities, Tier 1 penetration will be slow.
- Inventory normalization: Working capital days have risen sharply as management focuses on ensuring availability and stocking close to customer. These should logically reduce over time as pin code level data on demand patterns can help plan inventory better, but needs to be proven.
- Promoter over-promising: On concalls, management guided to 70–75% revenue growth for FY25 (actual was ~45%) and Rs. 500–600 Cr revenue by FY27. The FY27 target is now under pressure — Dr. Vikas later acknowledged giving “internal team targets publicly” as a mistake. We attribute this to inexperience in communicating with capital markets.
- Talent and processes: Scaling will require stronger systems and the right senior talent — a known challenge for small-cap companies. Management acknowledges these gaps and is actively working to address them.
- Execution bandwidth: Management is simultaneously pursuing online growth, offline expansion, Smileworks lab scale-up, exclusive international partnerships, service centre build-out, and 8+ new platform modules. The risk of operational overstretch is material and has already manifested in slower revenue growth in H1 FY26, which management itself attributed to internal re-organisation and warehouse transitions.
- Customer retention: Retention rate slipped from 76% to 70% in FY25 — a meaningful deterioration that management attributed to delivery timeline slippage due to a poor delivery experience3 primarily due to poor visibility of inventory in a marketplace model 4and for trying to deliver to pin-codes not serviced frequently by courier companies. Recent business model changes- for example move to inventory model – are designed to address this, but recovery is yet to be demonstrated even though the management team has suggested that improvement is visible due to a meaningful decline in customer service tickets related to delivery delays.
Few of the above risks, if they materialize longer term, can meaningfully compress returns. Against a base to bull case IRR of 25-45%, the bear case IRR could be closer to ~10%5. This wide dispersion of outcomes is precisely why position sizing is a critical part of our investment decision.
Position sizing
With history of very strong execution record in the past (30 Cr FY20 -> 241 Cr FY25 Revenue), the edge of a dominant online player, the long-term compounding opportunity, and the long-term orientation of promoters, we are keen to own Vasa with an “ownership mindset”. The stock has recently sold off because the market is perhaps disappointed by tepid growth in FY26. However, progress is seldom linear, especially in early stages of growth.
We have conviction. However, keeping in mind the margin and ROIC yet to be proven at scale, we have a hard cap of 3% in Prudence and 5% in the Micro-Cap AIF. If these are proven, we have the opportunity of an Asymmetric upside from both growth and multiple re-rating (~2x Sales could become ~4x Sales). We will revisit position sizing as evidence of execution is clearer — specifically watching for: (1) customer repeat buy, (2) inventory days beginning to stabilise or decline; (3) delivery timelines reaching sub-3-day national average; (4) revenue growth re-accelerating to 20%+ after the FY26 transition year.
Please click here if you would like to download the PDF version of this blog
- ROIC formula: EBIT/ (Net Block + Net Working capital) ↩︎
- Nykaa’s BPC segment operates with ~80-100 days of inventory ↩︎
- Delayed deliveries disrupt dentists’ procedure schedules (which are planned around expected product arrival), leading to a poor experience and lower retention. ↩︎
- A vendor may show inventory in its system which does not actually exist. ↩︎
- Bear case assumes 15% revenue CAGR to ~Rs. 600 Cr by FY31, ~7% PAT margins (Rs. 42 Cr PAT), and a 25x exit P/E, implying an exit market cap of ~Rs. 1,100 Cr vs. current market cap of Rs. 670 Cr. ↩︎