Summary
- Leading players in the QSR industry have all the key attributes of a good business we would like to own long term: growth longevity, 18%+ ROIC and low disruption risk.
- The sector is currently out of favour due to muted profit growth in recent years (weak consumer sentiment, Delivery Apps margin challenge, increased competitive intensity). But the long-term profitable growth story remains intact. The prevailing pessimism is creating reasonable to attractive entry points in many QSR names, especially in a market where value is hard to find. This is good for long-term investors.
RBA continues to execute well in India. This is despite a tough environment and significant distraction of a promoter exit. There was a Capital allocation error into Indonesia. We believe the management will take a rational call to exit Indonesia if cash losses there continue. It is a very attractively priced Asset, and hence we have continued to add to our position.
A good business has the following attributes:
- Large and growing opportunity which provides credible hypothesis for 15%+ growth for long periods of time.
- Healthy ROIC (we prefer 18%+), which ensures cash generation to fund this growth internally.
- Minimal disruption risk, so high terminal value.
Well-run, scaled QSR’s in India have all the above traits and are one of the best proxies to play India’s long-term discretionary consumption story as they are an affordable luxury. They can continue to grow Operating Profits at 15%+ for long periods, backed by 10-13% store additions, 3%+ SSSG (Same Store Sales Growth), opportunity to expand into adjacencies and some Operating Leverage.
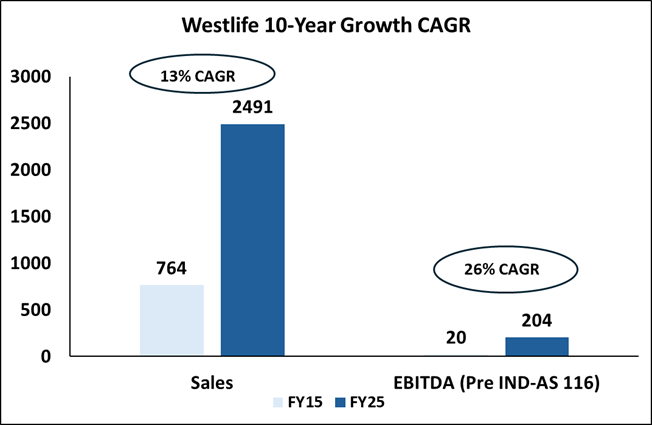
Take Westlife as an example (operates McDonald’s in West and South India). Over the last decade, the company has grown its Revenue and Operating Profits at 13% and 26%, respectively, despite challenges of Covid, a consumption slowdown and the margin challenge from Delivery Apps.
In the early years, when a brand is sub-scale, ROIC remains subdued. However, once scale is achieved, the steady-state ROIC of these QSR’s can expand to 25-40% – range depends on the strength of the brand. Over time, ROIC tends to improve as Maintenance Capex is much lower than Depreciation and store throughput steadily increases with SSSG, leading to expansion in Operating margins.
| Illustrative ROIC of a store in Year-3 | |||
| Particulars (Rs Cr) | Challenger Brand RBA (BK India) | Strong Brand Jubilant (Dominos India) | Remarks |
| Sales per store | 5.0 | 3.3 | |
| Restaurant operating profit margin | 15% | 19% | Higher throughput leads to higher Op-leverage |
| Restaurant operating profit per store | 0.8 | 0.6 | |
| Corp Over Head allocation | 0.2 | 0.1 | Steady state overheads are typically 3.5-4% of sales |
| Company level EBITDA (a) | 0.6 | 0.5 | |
| Capex per store (b) | 2.7 | 1.5 | Depends on store size format- Dine in vs Delivery |
| Net working capital per store (NWC) (c) | -0.4 | -0.3 | |
| GFA turns per store | 1.8 | 2.2 | This is driven by the throughput a brand can generate basis Capex (size of store) |
| NWC as % of sales | -8.0% | -8.0% | This is -ve 8-10% of sales |
| Capital invested (b+c=d) | 2.3 | 1.2 | |
| Company level pre-tax ROIC 1(a/d) | 25% | 40% | Formula: EBITDA/GFA + NWC |
Many market participants commenting that QSRs are loss-making or ridiculously valued as they look at PAT or PE ratios. This is misleading. The more relevant metric for a QSR in a rapid store expansion phase is Operating Cash Flow. When a company is adding stores rapidly, a large part of the store base is still immature and has not yet reached peak Revenue. Hence, all the cost including Depreciation, are not fully absorbed, resulting in a reported loss at the PAT level. Operating cash flows in these businesses are higher than the reported PAT, given that:
- The business is negative working capital.
- Physical life of a QSR store and Assets is often more than 15-20 years, and Maintenance capex remains lower than Depreciation.
Hence, Operating cash flows compound meaningfully over time.
Consider RBA’s example, where for the India business, over the last two years, reported PAT was negative, but the actual OCF (adjusted for IND AS-116 and one-off in working capital2 was much higher.
| RBA – India (Rs Crs) | FY24 | FY25 |
| Reported PAT | -69 | -88 |
| Reported OCF (Pre-IND-AS 116) | 156 | 155 |
| OCF adjusted for one-off (Pre- Ind AS 116) | ~100 | ~100 |
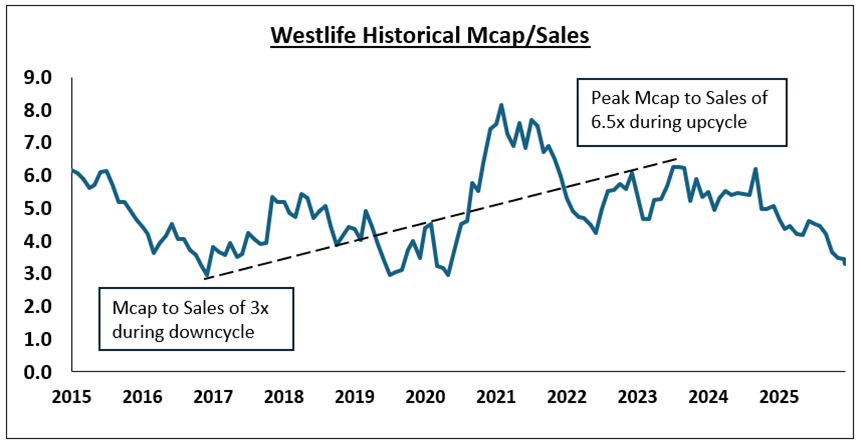
We believe the QSR sector is currently out of favour (reasons explained in the next section). Over the last 5 years, the entire sector’s stock price returns have been poor. Westlife, which has a long trading history, is trading close to its 10-year low valuations.3 This is a great set-up for a long-term investor.
| Particulars | 5Y stock price CAGR |
| Westlife Foodworld | 3% |
| Devyani International* | 3% |
| Jubilant Foodworks | -1% |
| Sapphire Foods* | -1% |
| Restaurant Brands Asia | -16% |
*CAGR since listing

What explains this pessimism?
The key to QSR economics is Same Store Sales Growth (SSSG), which measures year-on-year sales growth for stores that have been operational for at least 12 months, and Average Daily Sales (ADS). They determine profitability of this business.
When SSSG exceeds cost inflation (rent, wages, utilities, and input costs), operating leverage kicks in, fixed costs are absorbed more efficiently, and margins and ROIC improve. Conversely, when SSSG is below cost inflation, margins come under pressure even if reported revenue grows through store additions. A combination of SSSG and the mix of new stores vs mature stores determines the level of ADS (Average Daily Sales). Higher ADS means higher Revenue per store, and higher operating leverage, all else being equal.
Over the last 2.5 years, SSSG for most QSR players has slowed or turned negative.
Negative SSSG and rapid addition of new stores over the last 3 years have kept the ADS under pressure as well. As a result, operating margins for most QSR players have declined from their peak in FY23. RBA and Jubilant are exceptions.
| Brand / Company (India SSSG) | FY23 | FY24 | FY25 | Q1FY26 | Q2FY26 |
| Burger King / RBA | 23.1% | 2.9% | 1.1% | 2.6% | 2.8% |
| Dominos / Jubilant | 8.9% | -1.4% | 7.6% | 11.6% | 9.1% |
| McDonald’s / Westlife | 36.0% | -1.5% | -2.9% | 0.5% | -2.8% |
| KFC / Sapphire | 15.0% | -1.1% | -4.5% | 0.0% | -3.0% |
| KFC / Devyani | 16.0% | -4.6% | -6.4% | -0.7% | -4.2% |
Note: Jubilant reports Like for Like (LFL) growth and not SSSG but is a reasonable proxy.
| Company-level EBITDA Margin | FY23 | FY24 | FY25 | Q1FY26 | Q2FY26 |
| Burger King / RBA | 3% | 4% | 5% | 4% | 5% |
| Dominos / Jubilant | 15% | 13% | 12% | 12% | 12% |
| McDonald’s / Westlife | 13% | 11% | 8% | 8% | 6% |
| KFC / Sapphire | 14% | 14% | 12% | 11% | 9% |
| KFC / Devyani | 16% | 15% | 13% | 10% | 9% |
Note: Corporate overhead allocation for KFC is a Solidarity estimate.
Consumption sentiment remains weak
With almost two years of negative SSSG, the market expected that government measures such as Tax cuts, GST cuts, and repo rate cuts would lead to an improvement in SSSG. However, on-ground channel checks suggest that consumer sentiment remains weak despite these measures. With growth momentum missing for over 2.5 years, many investors have lost patience, leading to an intensified correction in the sector over the last two months.
Heightened competition
Over the last 4-5 years, QSRs expanded rapidly, increasing competitive intensity, even as demand remained subdued. 60-80% 4of QSR stores today are in metro and tier-1 cities. Given that much of this oversupply has come within the same catchments, it has led to cannibalisation of sales.
Additionally, unlike the earlier downcycle, many small regional brands and sub-scale cloud kitchens now have easy access to customers because of food aggregators/delivery apps. Therefore, as consumer traffic and spending slowed, dine-in and delivery footfall got spread across many brands and throughput per store came under pressure.
| No. of Stores | FY19 | FY25 | FY19-FY25 CAGR |
| KFC / Devyani | 134 | 696 | 32% |
| KFC / Sapphire | 158 | 502 | 21% |
| Burger King / RBA | 187 | 513 | 18% |
| Dominos / Jubilant | 1227 | 2179 | 10% |
| McDonald’s / Westlife | 296 | 438 | 7% |
Impact of Food delivery apps.
This has created some shift in consumption from “dine-in” to “delivery”, which has in turn impacted overall margins of the industry. Dine-in is structurally more profitable than delivery where the apps charge commissions. Hence, while Delivery apps marginally expanded the market, the absolute revenue growth contributed by this segment was at a significantly lower unit margin and hence did not result in a similar addition to profits.
We think with an “ownership mindset” and hence will not rotate in and out of sectors due to short term challenges if our long- term thesis remains intact. We remain constructive on the sector long -term and share our variant perception on some points.
Sector has longevity and is in the early stage of growth life cycle.
China has ~12,000 KFC and ~7,000 McDonald’s outlets, compared with around 1,200 KFC and ~700 McDonald’s in India. While India may not reach China’s store density, the comparison directionally shows the long growth runway ahead.
Eating out should be a structural growth story for India. The number of meals per month consumed out of home increases with GDP growth and rising per capita incomes. Therefore, the sector should grow significantly faster than nominal GDP growth.
Large brands will continue to become stronger and gain market share.
The industry is easy to enter, but it is hard to scale. Hence, the number of players that can scale to 1000+ stores and hence be profitable will be limited.
- To build brand equity and create pull/differentiation, continuous investment in marketing is required. Despite inheriting some brand equity from their global parents, Western QSRs still spend around 5-6% of sales on marketing. As the revenue base expands, the absolute marketing spend creates a flywheel, making larger brands stronger, which is difficult for sub-scale brands to replicate.
- New QSR brands find it tough to get good retail locations, and it is even tougher to lock in long-term leases at reasonable rates. Except for the top 5-7 QSR’s, very few QSR’s can lock in real estate for 15+ years.
- While revenue per store has reduced for listed QSRs, on an overall basis, these QSRs have grown sales significantly ahead of industry growth rates due to store additions. Hence, we expect them to continue to gain share from unorganised players.
More focus on dine-in will aid margin recovery.
Leading QSR’s have grown their delivery business faster than the total food delivery market. Hence, they have leveraged this distribution channel better and further gained market share from unorganised players.
| Food Delivery Business | FY20-25 CAGR |
| Online Food Delivery Market 5 | 24% |
| KFC-Devyani | 57% |
| KFC-Sapphire | 39% |
| BK-RBA | 27% |
Note: Jubilant has always focused on delivery, and Westlife reports delivery and drive-thru revenues together and given that they have a meaningful drive-thru business, which we can’t disaggregate, we have excluded them here.
However, Delivery via aggregators has impacted margins. We see QSRs focusing on growing the ‘dine-in” share of their business mix through menu innovation etc. As the share of dine-in improves, margins should improve.
Additionally, a fair share of incremental QSR growth will come from non-metro markets. Given the lower population density in these regions, delivery economics for food aggregators will be more challenging. Therefore, it remains an open question whether aggregators can take a similar market share from dine-in, comparable to what they have achieved in metros. And therefore, as QSRs grow in non-metro markets, dine-in share as % of total may improve aiding margins.
QSRs will become better businesses over time.
QSRs have continued to expand store count despite the slowdown. Given the aggressive expansion over the last few years, ~25–40% of the store base for most QSRs is still immature and operates at lower profitability. Over time, the cyclicality of reported profits will reduce as the number of immature stores (not breakeven) keeps reducing as a % of the total.
Profits are linked to SSSG which tends to be cyclical. There is a discretionary consumption slowdown in the economy at present. Over the last 5 years, i.e., FY20-FY25 annual household income for urban affluent, emerging, and mass (which makes ~65% of urban India and are primary consumers of QSR’s) is low single digit vs low teens over FY10-FY20. 6
| Annual Household Income (in Rs) | FY10-FY20 CAGR | FY20-FY25 CAGR |
| Urban Affluent | 11.4% | 3.5% |
| Urban Emerging | 10.3% | 3.5% |
| Urban Mass | 7.7% | 0.3% |
However, this is unlikely to be permanent. As the SSSG starts to revive, profits should expand at a faster pace due to operating leverage and the natural maturation of newer stores.
ROIC per store tends to increase over time as stores mature. Given the high-ROIC nature of the business, these companies will generate meaningful free cash flows over time. These cash flows are likely to be reinvested into adjacencies, such as Jubilant (Pizza) entering Popeyes (Chicken) or Devyani (Fried Chicken) entering new formats such as “Vaango” (South Indian) and “Costa Coffee,” giving longevity to growth and profits.
RBA continues to execute well.
RBA continues to execute well in India. Despite being a much younger brand compared to other QSR’s and having a higher mix of non-mature (loss making) stores, they have reported positive SSSG. This positive SSSG momentum has helped them maintain Operating Profit margins and grow absolute profits, even when others have de-grown because of the downcycle.
| Company level EBITDA (Pre IND-AS-116) | FY23 | FY24 | FY25 |
| Burger King / RBA | 36 | 75 | 99 |
| Jubilant/ Standalone | 785 | 674 | 726 |
| McDonald’s / Westlife | 301 | 270 | 204 |
| KFC / Sapphire | 199 | 247 | 234 |
| KFC / Devyani | 285 | 302 | 287 |
Note: Corporate overhead allocation for KFC is a Solidarity estimate.
The India Balance Sheet is healthy, with net Cash of around 270 Crs. This, along with internal accruals are sufficient to fund capex for the next 2-3 years even if the downcycle of SSSG persists.
The Indonesia business remains a drag, with an annual burn of Rs ~45-50 crs funded by the India entity. As a result, the market is ascribing a negative value of ~500-700 crs to Indonesia, and the lack of visibility on specific actions is not helping the stock price. We believe the Indonesia business has significant long-term potential. However, resource constraints need to be at the heart of strategic choices. We believe this management team is rational and will exit this business if cash losses continue (they have alluded to this on their investor calls as well) and not fund losses by diluting their ownership in the more attractive India business indefinitely. When this happens, it should trigger a re-rating from current valuation levels as a Capital allocation error is decisively addressed.
We believe the stock is also under pressure because of fatigue from the constant news flow of the PE investor Everstone wanting to exit. The market is unclear who they are betting on and waits for certainty.
Basis scenarios of the future, we believe RBA could deliver between 375-450 Cr Operating Cash Flow by FY30. If they can execute on this and find a solution for Indonesia, RBA is well-positioned for an Asymmetric upside.
Conviction will be tested. But patience will be rewarded.
The QSR sector provides a very attractive hunting ground with stocks quoting at 4-year lows in a market where opportunity in sectors one would like to own long-term is narrow. Stock prices shape narratives, and the pessimism today reflects a prolonged slowdown or permanent shift in power towards Delivery Apps. This is not our base case scenarios.
Historically, valuation multiples have re-rated dramatically when the cycle shifts as Operating profits revert exponentially when SSSG turns. The stocks then are like compressed springs which may come back strongly when sentiment turns.
Please click here if you would like to download the PDF version of this blog
- While the standard formula is EBIT/(NFA+NWC), an owner can alternatively think about it as EBITDA/GFA+NWC. ↩︎
- Solidarity estimate ↩︎
- Market Cap/Sales is not the ideal metric to track valuation. We have used it as a rough proxy to show the sector trend. On a steady state basis, we value QSRs at between 20-30x OCF. ↩︎
- Source: ICICI Securities ↩︎
- Source: Swiggy QIP document ↩︎
- Source: CLSA, Income tax filing data, EPFO, Nabard Nafis. ↩︎